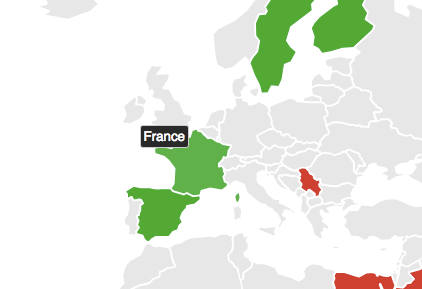
Make your own “countries visited” map or express any other data on a world map with React. This is suitable if you want to color countries based on data, i.e., countries with highest/lowest population growth, countries you travelled to, greenest vs most polluted, etc. And you want it to look something like this:

We’ll use react-jvectormap library which is great if you just want to show statistics for selected countries. Currently it only has a world map and a USA map (but there is a broader selection of maps at jVectorMap if you don’t mind working with jQuery).
How the maps work underneath is that they consist of two modules: maps converter written in Python and jQuery plug-in which renders maps and provides JavaScript API to control them. jVectorMap uses only native browser technologies like JavaScript, CSS, HTML, SVG or VML, which allows jVectorMap to work in all modern mobile browsers.
To get started with the map, let’s add the dependency to our React app:
npm i react-jvectormap& import it:
import { VectorMap } from "react-jvectormap"& add this link in your index.hmtl file:
<link rel="stylesheet" href="https://cdnjs.cloudflare.com/ajax/libs/jvectormap/2.0.4/jquery-jvectormap.css" type="text/css" media="screen"/>Then comes the data. We need to use countries codes & all values must be positive numbers. This is where you will be looking to automate the process and loop through your own data. Values will correspond to your selected color scale. Example structure:
const mapData = {
  CN: 100000,
  IN: 9900,
  SA: 86,
  EG: 70,
  SE: 0,
  FI: 0,
  FR: 0,
  US: 20,
};
To help get the countries codes quick, I use this tool:
npm i country-listDon’t forget to require it and then log what you want to find.
const { getCode, getName, getData } = require("country-list");console.log(getName('IS'));  // Iceland
console.log(getCode('Iceland')); // ISconsole.log(getData())  //gets an array of all countries names & codes: [{code: "AU", name: "Australia"}, ...]
Once we have the codes sorted and we know what countries we want to mark on the map, this is the component that will do that for us:
import React from "react";
import { VectorMap } from "react-jvectormap";const mapData = {
  CN: 100000,
  IN: 9900,
  SA: 86,
  EG: 70,
  SE: 0,
  FI: 0,
  FR: 0,
  US: 20
};const handleClick = (e, countryCode) => {
  console.log(countryCode);
};const Map = () => {
  return (
    <div>
      <VectorMap
        map={"world_mill"}
        backgroundColor="transparent" //change it to ocean blue: #0077be
        zoomOnScroll={false}
        containerStyle={{
          width: "100%",
          height: "520px"
        }}
        onRegionClick={handleClick} //gets the country code
        containerClassName="map"
        regionStyle={{
          initial: {
            fill: "#e4e4e4",
            "fill-opacity": 0.9,
            stroke: "none",
            "stroke-width": 0,
            "stroke-opacity": 0
          },
          hover: {
            "fill-opacity": 0.8,
            cursor: "pointer"
          },
          selected: {
            fill: "#2938bc" //color for the clicked country
          },
          selectedHover: {}
        }}
        regionsSelectable={true}
        series={{
          regions: [
            {
              values: mapData, //this is your data
              scale: ["#146804", "#ff0000"], //your color game's here
              normalizeFunction: "polynomial"
            }
          ]
        }}
      />
    </div>
  );
};export default Map;
I’m using #146804 green for the lowest value and #ff0000 red for the highest.
Our map is zoomable and you can choose on what to display once a country is clicked, i.e., some charts, images, etc. More props are available here.
Now go and make that “countries visited” map you’ve always wanted to have, where you can add new countries as you go. You have the perfect tool. Or map some world’s data for your projects.
Here’s a mini project example on my GitHub: custom-world-map